Create boxplots with ggplot2.
bboxplot(y, ...)

# S3 method for default
bboxplot(y, g, data, ...)

# S3 method for formula
bboxplot(formula, data, ...)
Arguments
| y | a numeric variable for which the boxplot is to be constructed. |
|---|---|
| … | further arguments passed to |
| g | a grouping variable, usually a factor, for constructing parallel boxplots. |
| data | a dataframe containing the variables. |
| formula | A model formula of the form ~ y to produce a boxplot for the variable y, or of the form y ~ g to produce parallel boxplots for y within levels of the grouping variable(s) g, etc., usually factors. |
Value
A boxplot of the variable y or the boxplot of the y
against g.
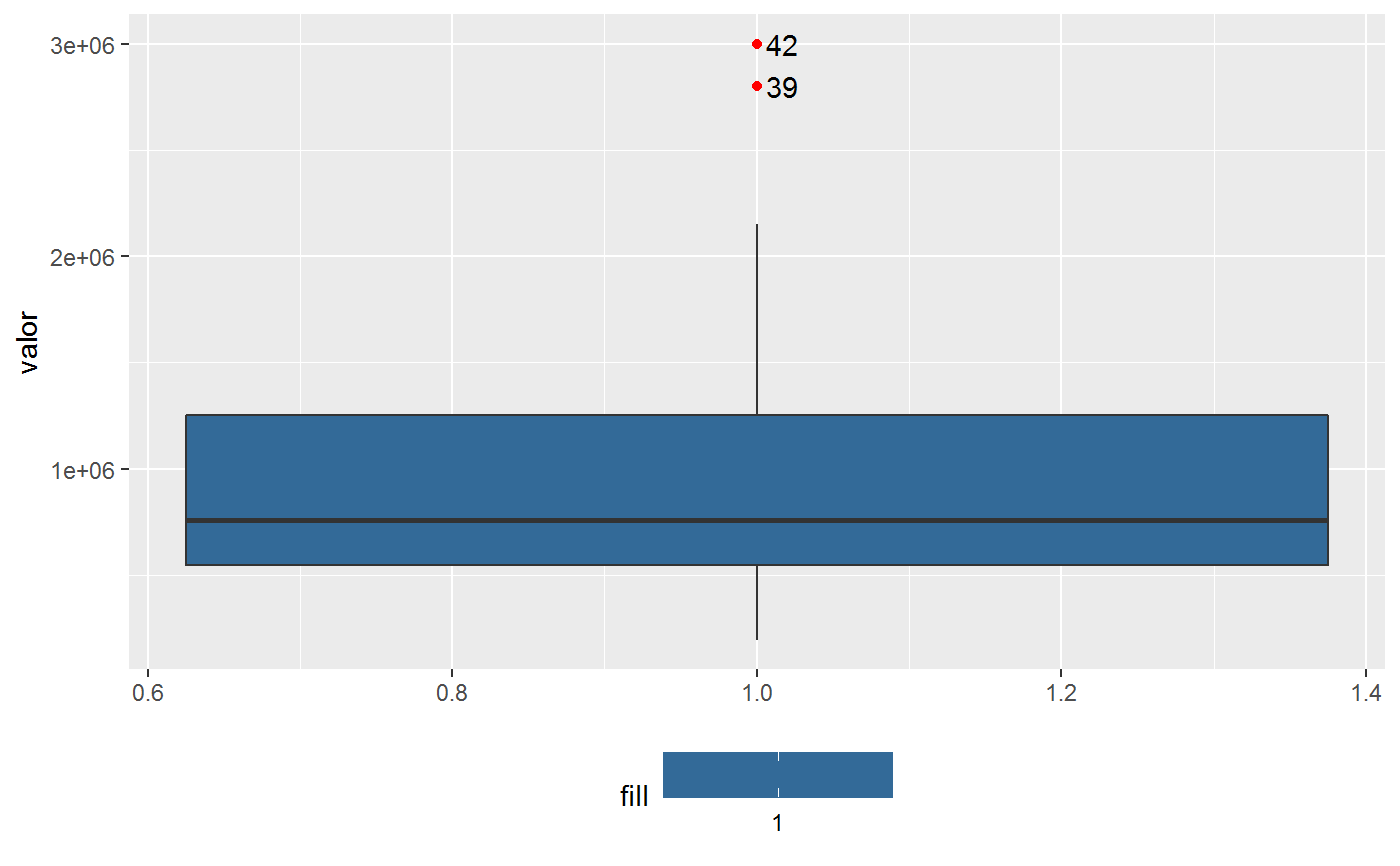
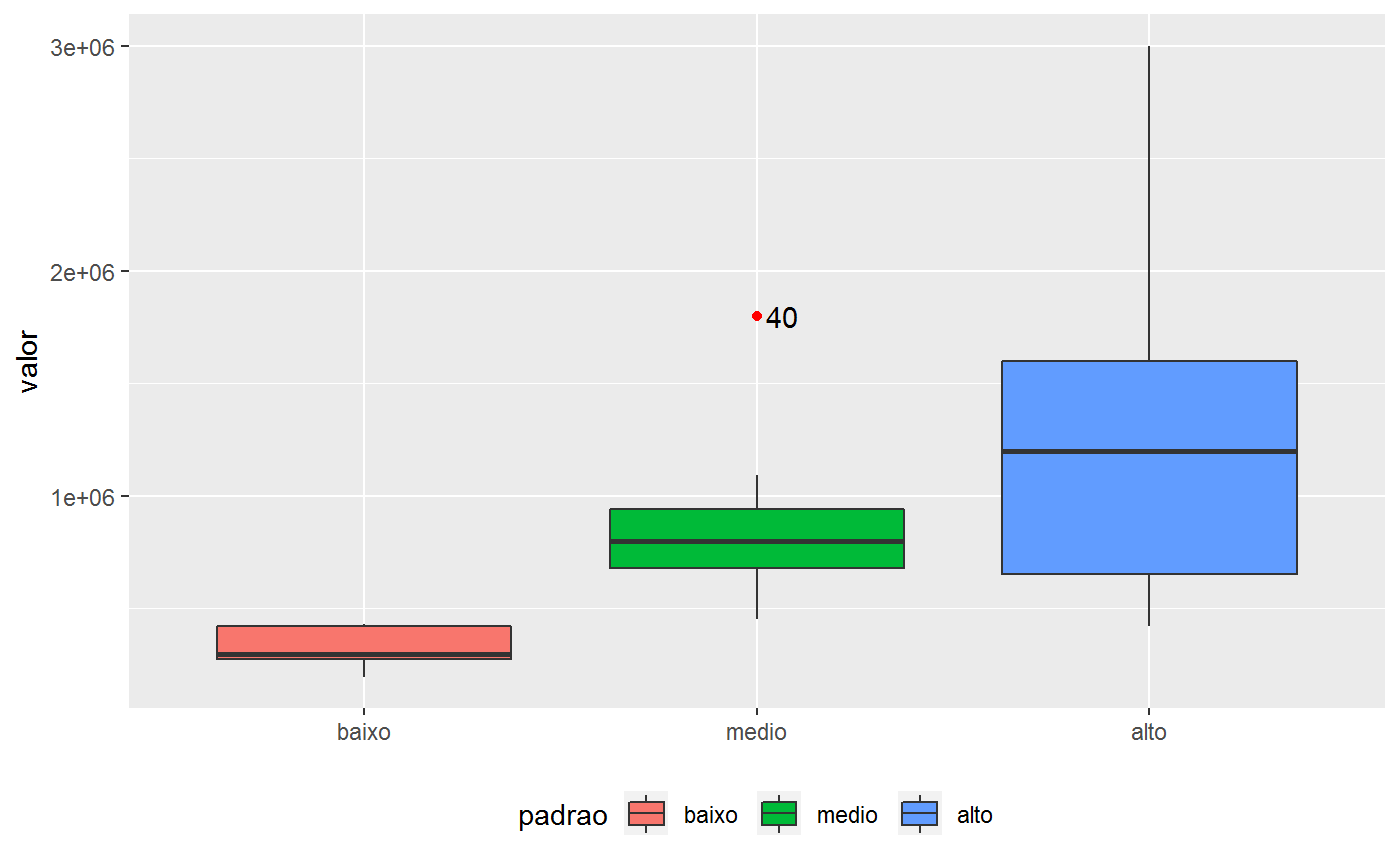
Examples
data <- as.data.frame(centro_2015@data)
bboxplot("valor", data = data)bboxplot("valor", "padrao", data)bboxplot(valor~padrao, data)bboxplot(~valor, data)